You tap a link to a restaurant’s menu. The header appears, then a grey box sits there for three seconds. When the food photo finally lands, it shoves the “Order now” button down just as your thumb arrives, and you’ve opened the opening-hours page instead. You tap back. Nothing. You tap again.
That one visit failed all three Core Web Vitals in about ten seconds. Google gave these measurements dull names, but what they describe is familiar to anyone with a phone: waiting, lag, and things jumping around. Here’s what each one measures, and how much it really matters for a business site.
The three numbers, in plain terms
LCP: when the main thing shows up
Largest Contentful Paint is the moment the main content appears. Think of a waiter. The bread basket and the water don’t count. What counts is when the dish you ordered is on the table.
Technically, it’s the time from when the page starts loading until the biggest image, video or block of text in the visible area has finished drawing. On most small-business sites that’s the hero photo or the main headline.
INP: how fast the page answers you
Interaction to Next Paint is the light switch test. You flick the switch and expect the light now, not after a pause. INP watches every click, tap and key press during the whole visit, times how long each takes to produce a visible change on screen, and reports roughly the slowest. Scrolling, hovering and zooming aren’t counted. On busy pages Google drops one of the slowest interactions for every 50, so a single freak delay won’t sink you.
It replaced an older metric, First Input Delay (FID), on 12 March 2024. FID only measured the wait before the browser started handling your very first tap. The second tap, the tenth, and the time the work itself took were all invisible to it. Plenty of pages scored well on FID and still felt sticky to use, which is why it went.
CLS: things jumping around
Cumulative Layout Shift measures unexpected movement. It’s a newspaper that rearranges its columns while you’re halfway through a paragraph. Each shift is scored by how much of the screen moved multiplied by how far it moved, and CLS is the total from the worst burst of shifting during the visit. Movement you caused yourself, within half a second of a tap or key press (opening a menu, say), doesn’t count against you.
Where the lines are
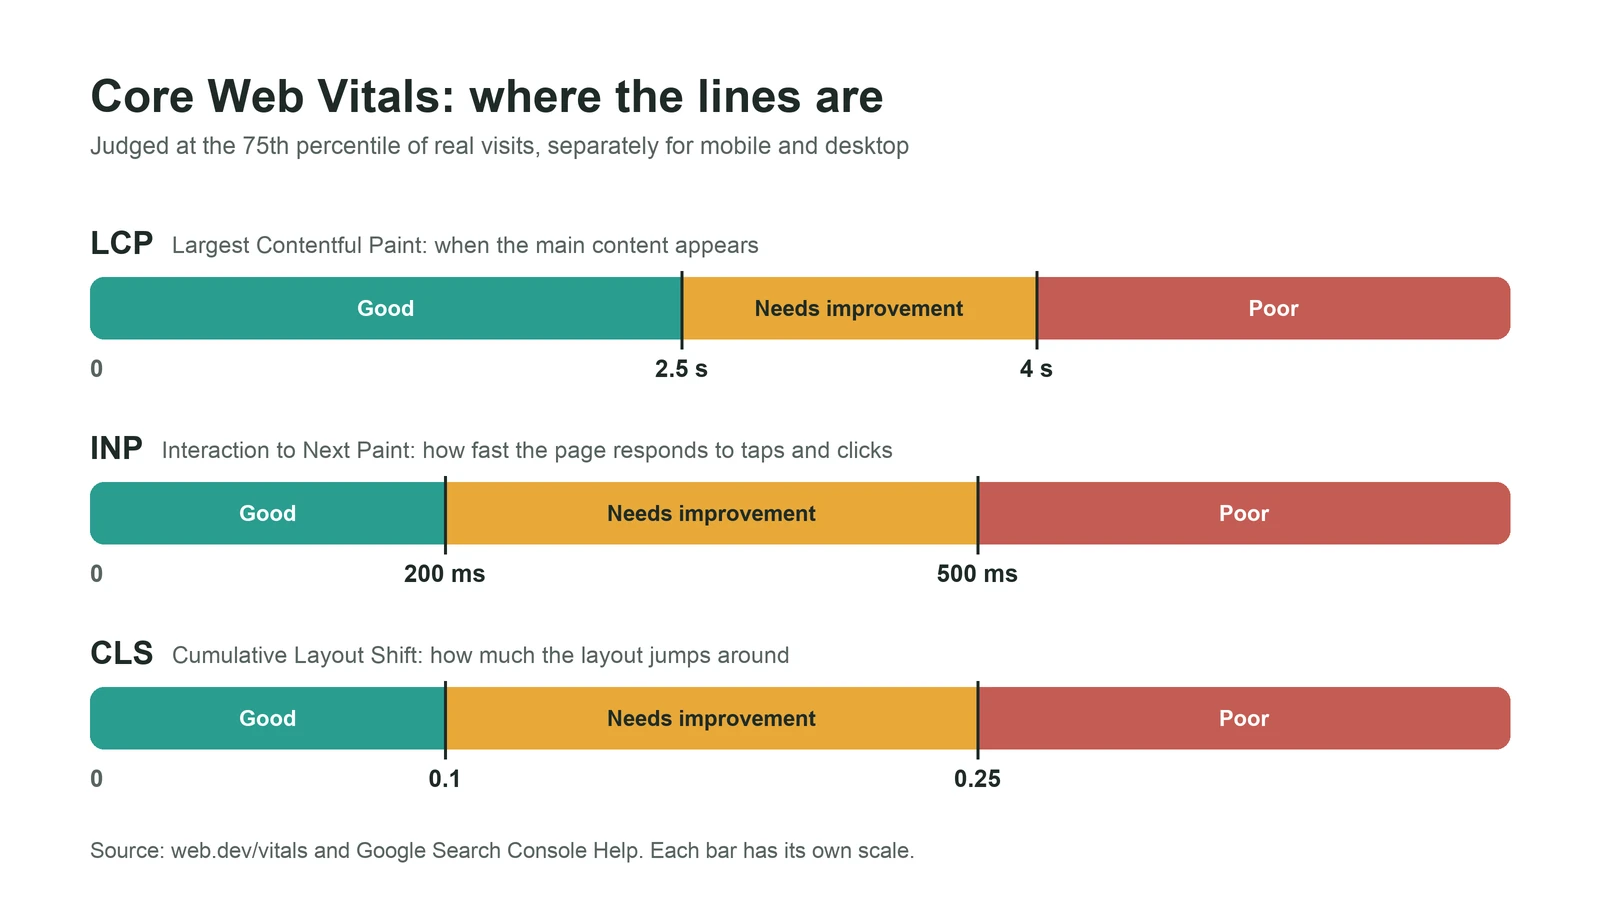
| Metric | Good | Needs improvement | Poor |
|---|---|---|---|
| LCP | 2.5 seconds or less | up to 4 seconds | over 4 seconds |
| INP | 200 ms or less | up to 500 ms | over 500 ms |
| CLS | 0.1 or less | up to 0.25 | over 0.25 |
Then there’s the 75th percentile rule, which surprises people. Google doesn’t judge a page by its average visit, or its best one. It lines up all the real visits, separately for mobile and desktop, and looks at the one three-quarters of the way down the list. If that visit is in the good band for all three metrics, the page passes.
So a site that feels quick on your office Wi-Fi can still fail. Say you run a bakery in Pune and lots of your orders come from mid-range Android phones on patchy mobile data. Those slower visits are the ones that decide your score. We think that’s fair. The 75th percentile is a polite way of saying “most of your customers, including the ones having a bad network day”.
Why your score changes depending on where you look
This catches out nearly every client we work with. They run PageSpeed Insights, get a performance score of 92, then open Search Console and see “Poor”. Neither tool is lying. They’re measuring different things.
Field data comes from real people. Google’s Chrome User Experience Report (CrUX) collects anonymous measurements from Chrome users on desktop and Android who’ve opted in to sharing usage statistics, over the previous 28 days. This is the data Search uses. Two consequences. Visitors on Safari, or on Chrome for iPhone, aren’t in it at all. And a fix you ship today takes up to four weeks to show fully, because the older, slower visits only roll out of the window gradually.
Lab data comes from one simulated test. Lighthouse, the engine behind the PageSpeed Insights score, loads your page once, on a pretend mid-range phone, at a fixed network speed, with an empty cache, from a single location. Because it’s repeatable, it’s good for debugging. It isn’t your customers.
The gaps run both ways. Real visitors may already have your files cached, which makes them faster than the lab. They may also be on older phones, further from your server, or seeing a personalised page, which makes them slower. And a standard lab test can’t measure INP at all, because nobody is tapping anything; Lighthouse shows Total Blocking Time as a stand-in.
Our rule of thumb: field data tells you whether you have a problem, lab data helps you find out why.
One more wrinkle for small sites. CrUX only reports pages and sites with enough traffic, and Google doesn’t publish the cut-off. Without enough visits, PageSpeed Insights falls back to data for your whole domain, or shows none. That’s normal for a new site. It isn’t a penalty.
How much they matter for Google ranking
Less than the SEO industry suggests. More than zero.
Google’s own page on the subject says plainly that “Core Web Vitals are used by our ranking systems.” The same page says there’s no single page experience signal, that Google “always seeks to show the most relevant content, even if the page experience is sub-par”, and that good scores don’t guarantee a top spot. It even warns that chasing a perfect score just for SEO may not be the best use of your time.
Here’s how we read that. If your page is the best answer to a search, a slow hero image won’t stop it ranking. If you’re one of ten equally useful pages, page experience can be part of what separates you. Where we’d push harder is the business case, which is stronger than the SEO one. A page that loads quickly, answers taps and doesn’t move under people’s thumbs loses fewer customers. Nobody needs Google to confirm that a button which runs away from your finger is bad.
What we won’t do is tinker with a page that’s already green to get LCP from 1.9 seconds to 1.6. That afternoon is better spent writing something useful.
The usual culprits, and what fixes them
Most failing sites we look at fail for the same few reasons.
Slow LCP
Usually the hero image, or the server.
- The hero image is too heavy. Resize it to the size it’s actually displayed at, and serve WebP or AVIF.
- The hero image is lazy-loaded. Lazy loading is great further down the page and wrong for the main image. Google’s own guidance says never to lazy-load your LCP image. Adding
fetchpriority="high"to it tells the browser to fetch it first. - The browser finds the image late, because it’s a CSS background or gets injected by JavaScript. Put it in the HTML as a normal image, or preload it.
- The server is slow to send the first byte. Page caching and a CDN sort out most of this, and on cheap shared hosting it’s often the biggest single delay we find.
- CSS and scripts in the page head block rendering. Defer anything the first screen doesn’t need.
Poor INP
Nearly always too much JavaScript. While the browser’s main thread is busy running a script, your tap waits in the queue.
- Break up long tasks. Any chunk of work over 50 milliseconds counts as a long task and holds up taps until it finishes. Splitting it and yielding to the browser in between (for example with
scheduler.yield(), where it’s supported) lets taps through. - Do less inside click handlers. Show the visual change first, like the pressed button or the opened menu, and do the slow work afterwards.
- Cut third-party scripts. Chat widgets, heatmaps, three analytics tags and a pop-up builder all fight over the same thread. On WordPress sites this is the cause we run into most.
- Keep the page’s HTML lean. A huge page takes longer to redraw after every interaction.
High CLS
Something arrived late and nobody saved it a seat.
- Images and videos without
widthandheightattributes, or a CSSaspect-ratio. The browser can’t reserve space, so everything below jumps when they load. - Ads, embeds and iframes. Reserve their space with a minimum height before they load.
- Banners injected at the top after the page loads. Cookie bars and “free delivery” strips are repeat offenders. Overlay them or put them lower down.
- Web fonts that swap in at a different size from the fallback. Preload the main font and pick a fallback with similar proportions.
- Animations that change position or size. Use CSS
transforminstead.
Where to check yours
Two free tools cover it.
PageSpeed Insights (pagespeed.web.dev): paste in a URL. The top section, “Discover what your real users are experiencing”, is the CrUX field data for the last 28 days, with a pass or fail for Core Web Vitals. The big score underneath is the lab test. Read the top part first.
Search Console’s Core Web Vitals report uses the same field data but groups similar pages together, so you can see whether all your product pages, or all your blog posts, share a problem. Each group takes the status of its worst metric. Once you’ve fixed something, click “Start tracking” and Search Console watches it for 28 days before marking it fixed.
If you do one thing this week, open PageSpeed Insights on your homepage and your busiest page, switch to the mobile tab, and see which of the three numbers isn’t green. Start there.
Sources and further reading
- Web Vitals — web.dev
- Largest Contentful Paint (LCP) — web.dev
- Optimize Largest Contentful Paint — web.dev
- Interaction to Next Paint (INP) — web.dev
- Interaction to Next Paint becomes a Core Web Vital on March 12 — web.dev
- Optimize Interaction to Next Paint — web.dev
- Optimize long tasks — web.dev
- Cumulative Layout Shift (CLS) — web.dev
- Optimize Cumulative Layout Shift — web.dev
- Why lab and field data can be different — web.dev
- CrUX methodology — Chrome for Developers
- About PageSpeed Insights — Google for Developers
- Understanding Core Web Vitals and Google search results — Google Search Central
- Understanding page experience in Google Search results — Google Search Central
- Core Web Vitals report — Search Console Help
Image credits: Banner photo by Luke Chesser on Unsplash. Photo by Chris Liverani on Unsplash. Diagrams and illustrations marked as such were created with AI (Claude) for iZenesis.